The JavaScript Console Methods You're Not Using
The JavaScript Console Methods You're Not Using
I spent forty minutes adding and removing console.log statements to chase a state machine bug. A single console.trace() would have shown me in five seconds that a forgotten useEffect was firing the reducer twice. Most of us reach for console.log and stop there. The console object carries a dozen methods that solve specific debugging problems, and ignoring them costs real time.
console.table: Read Arrays Without Scrolling
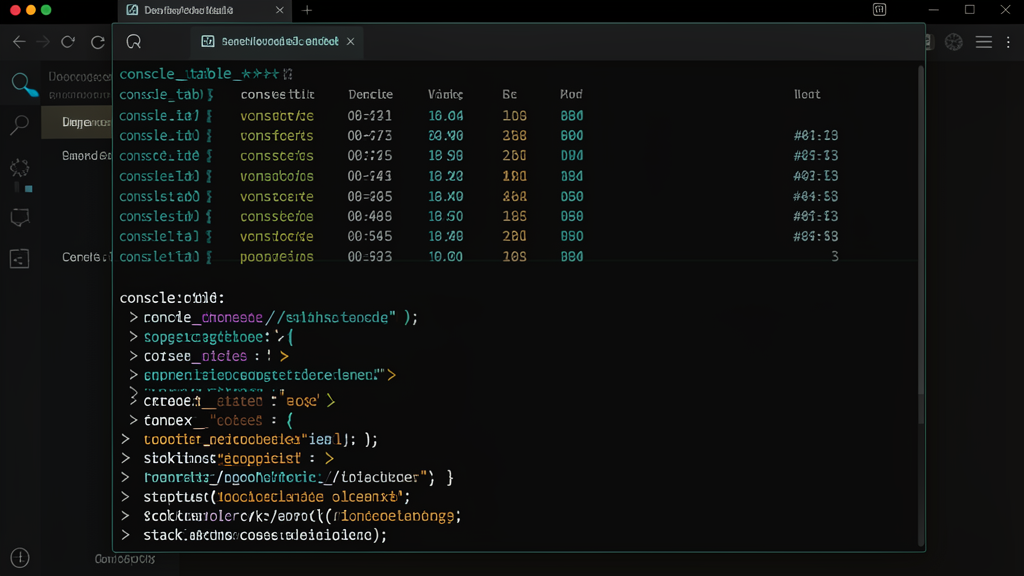
When you log an array of objects, DevTools prints a nested tree you expand one node at a time. console.table(data) renders the same data as a grid. Columns line up. You scan ten rows in a glance instead of clicking through them.
I reach for this whenever I inspect API responses. A payment provider returns a list of transactions, and console.table(transactions) puts the status, amount, and currency for all of them on one screen. Most debugging time goes to reading your own data. This method cuts that friction.
console.time: Measure Without the Performance Tab
You suspect a function is slow. Opening the Performance tab, recording a trace, and decoding a flame chart takes effort. Drop this in instead:
// jsconsole.time('parse');
parseTransactions(payload);
console.timeEnd('parse');
// parse: 247.3ms
For a thirty-second hunch, console.time beats the full profiler. I use it to compare two implementations side by side: time one, time the other, pick the winner.
console.group: Structure Related Logs
A single request can trigger four or five log statements, and your console turns into noise. console.group('order-1234') collapses them under a header. console.groupEnd() closes it. console.groupCollapsed folds them by default.
This reshaped how I debug request handlers. Instead of grepping through interleaved logs, I expand one group per request and follow the sequence top to bottom.
console.trace: Find the Caller
The most underrated method on the object. console.trace() prints the full call stack at the point of execution. Half the bugs I chase come down to one question: who called this function, and why. console.log tells you the value. console.trace tells you the source.
When a function fires twice and you cannot see why, drop console.trace() at the top of it. The stack reveals the culprit in the first frame.
console.count: Track Repetition
console.count('render') logs the number of times the code reached that line. It answers a frequent question: is this component re-rendering more than I think. Pair it with console.countReset between test runs.
The Trade-off
Treat these as development-only tools. Strip them before shipping. A console.log left in production is a leak. A console.table on a 10,000-row dataset in the hot path is a performance regression. Use them to think faster in development, then remove them when the bug is dead.
Skip the debugging library. The console methods you have ignored since the first day you opened DevTools handle most bugs on their own.
$ /related
Container Queries Finally Fixed Responsive Design
CSS container queries let components adapt to their own size, not the viewport. The shift from viewport-based thinking changes everything about responsive design.
TypeScript Discriminated Unions: The Pattern I Use in Every Project
Why discriminated unions are the most practical TypeScript pattern for state, API responses, and form handling, with code examples from real production systems.
Why I Stopped Using Redux and Never Looked Back
After years of reaching for Redux on every project, I switched to a three-tool stack that matches the problems I solve. Here is what changed and when Redux still wins.